Stock Support and Resistance
Topics
- Price areas
- Types and strength
Price areas
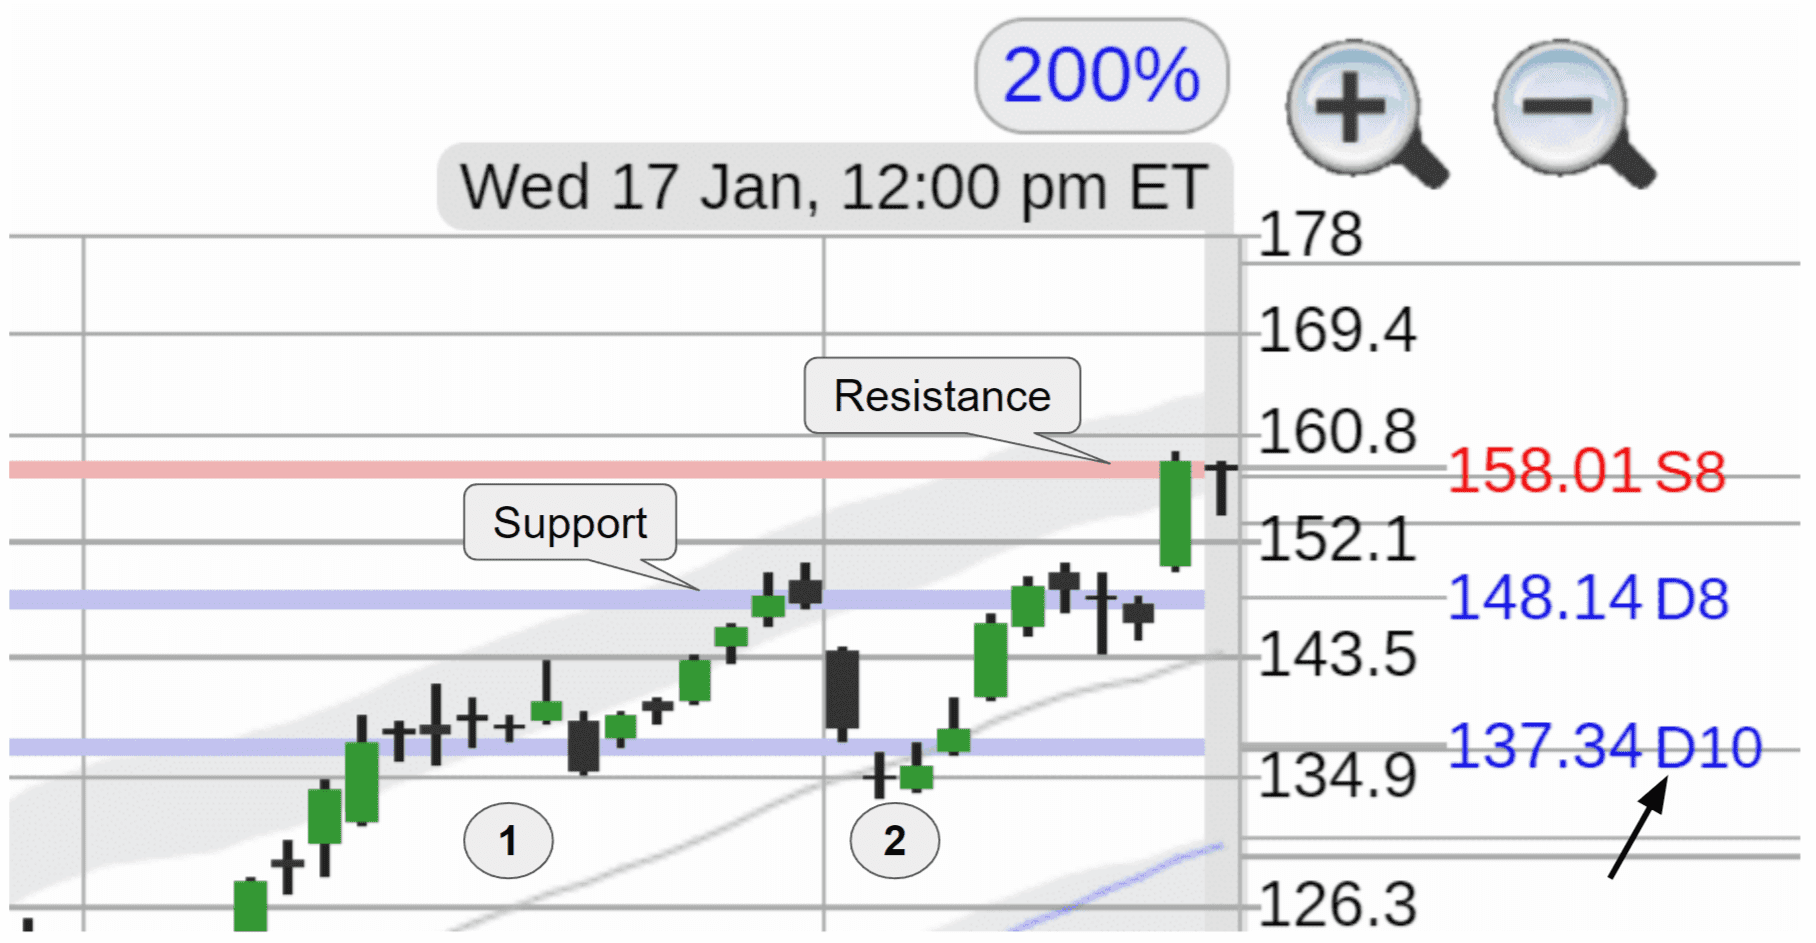
- Stock support is a price area at or below the current price, which provides support against any downward movement. The stock may pull back to support, labeled as blue lines on the 8 month chart.
- Stock resistance is a price area at or above the current price, which provides resistance against any upward movement. The stock may rally to resistance, labeled as red lines on the 8 month chart.
- A neutral "support or resistance" price area provides both resistance from upward movement
and support from downward movement and is labeled as grey lines on the 8 month chart.
Types and strength
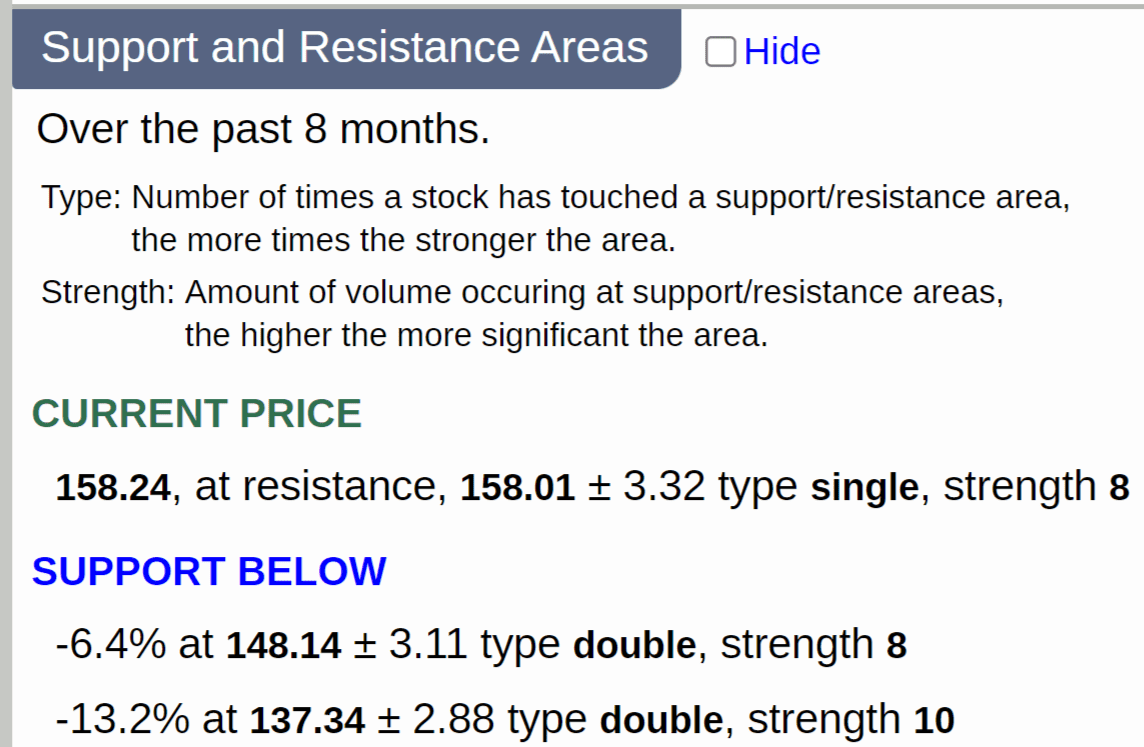
- Support and resistance areas have a (+ and -) width in stock points.
- The type refers to the number of times a stock bounced off support or rejected resistance areas over the past 8 months (Single=1 time, Double=2 times, Triple=3 times, Triple+= more than 3 times); the more times, the stronger the support or resistance area.
The types vary from the weakest Single (S), Double (D), and Triple (T) to the strongest Triple (T+) and are labeled S, D, T, and T+ on the stock chart.
- Each area has a strength that varies from 1-10. This number represents the
total stock accumulation or distribution volume in each area.
- Weak support and resistance areas created with light distribution or accumulation volume have strength from 1-3.
 Double support example
Disclaimer: This is NOT investment advice, just general help and opinions. Please check with a registered investment
advisor before making any investment decisions. This
document may contain errors. Chapman Advisory Group LLC employees are not investment advisors. Please review:
https://www.stockconsultant.com/disclaimerpage.html


