8 Month Daily Stock Chart
Topics
- Stock Chart Overview
- SmartVolume
- DualVolume, 3 Day Candlestick
Stock Chart Overview
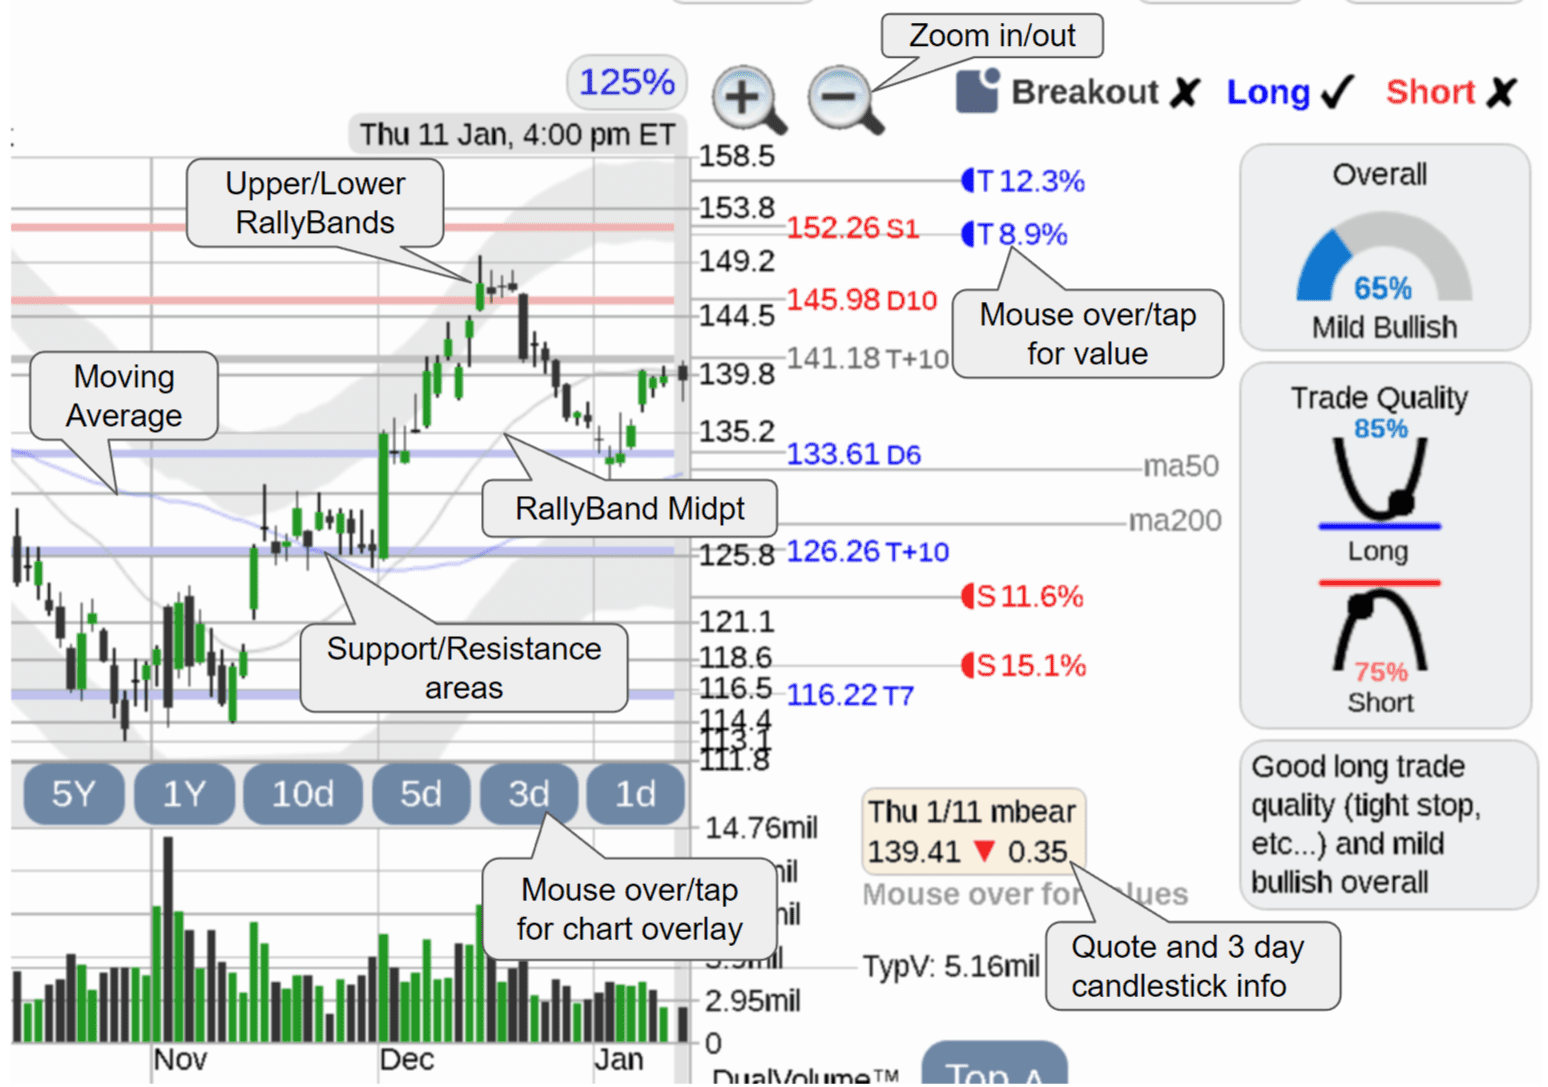
- The 8 month daily stock chart is updated intraday.
- Mouse over/tap target, breakout, 50ma, and 100ma labels to display values.
- Tap the zoom n/out buttons for 100-200% chart zoom (125% recommended).
You can set the default chart zoom in the chart options.
- Mouse over/tap the chart overlay buttons for an intraday real-time or long-term chart.
- Simple moving average lines can be set with the chart options.
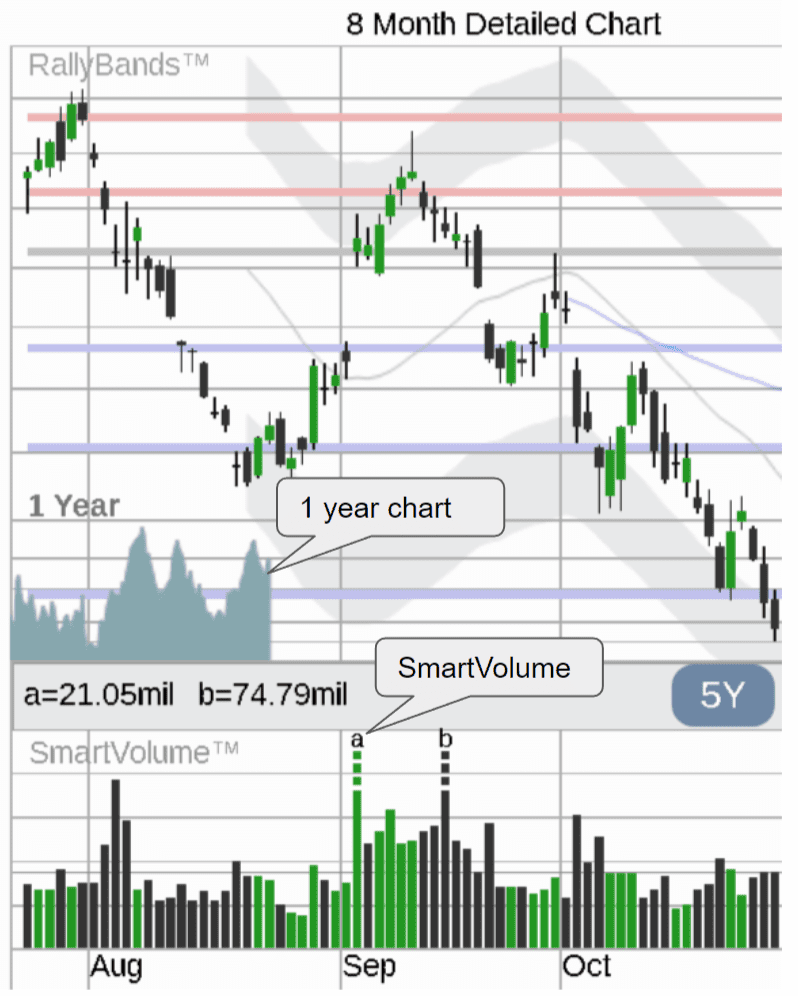
- RallyBands (and midpoint) is plotted on the chart to note typical and extreme rally and pullback price areas.
- Support (blue) and resistance (red) area lines. A support or resistance area line is labeled grey.
- An information box contains the latest stock quote, change, and type of 3 day candlestick.
SmartVolume
- SmartVolume removes up to three stock volume peaks (adding a letter and value to each peak), making it easier to read the volume details.
DualVolume, 3 Day Candlestick
- The DualVolume chart separates up and down volume to show strong buying and selling areas.
- The 3 day candlestick chart shows the transition from rally to pullback areas and vice versa.
Disclaimer: This is NOT investment advice, just general help and opinions. Please check with a registered investment
advisor before making any investment decisions. This
document may contain errors. Chapman Advisory Group LLC employees are not investment advisors. Please review:
https://www.stockconsultant.com/disclaimerpage.html


