Position Stock Indicators
Topics
- Positioning Indicators
- 1 Day Price Change
- Short Term Direction
- Overbought/sold
- 1 Month Trend
- Intermediate Trend
- Support/Resistance
Positioning Indicators
- Provide information on a stock's recent rallies and pullbacks.
- Information on whether a top or bottom will form.
- Provide the odds of a stock remaining overbought or oversold levels.
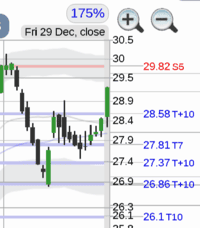
1 Day Price Change
- A short-term stock indicator which describes how much a stock has moved up or down from yesterday's close.
- The current stock price move is compared to past price movements and varies from 0-2 for flat, up to 9-10 for an extreme 1 day up or down price change.
 Extreme 1 day price change
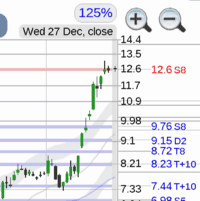
Short Term Direction
- A short-term indicator that captures stock rallies and pullbacks from 3 days
to 3 weeks. (Note: The Overbought/sold indicator is used capture longer 1-3 month rallies and pullbacks.)
- The current rally or pullback is compared to past rallies or pullbacks and varies
from 0-2 for flat, up to 9-10 for extreme readings.
 Extreme short term direction rally
Overbought/sold
- A medium-term indicator that captures a 1-3 month long stock uptrend or downtrend rally or pullback and signals whether it is overbought (on a rally/uptrend) or oversold (on a pullback/downtrend).
- Month-long rallies or pullbacks can cause extreme overbought or oversold readings in the 9-10 range.
1 Month Trend
- A short-term indicator that examines how fast the stock price has risen or fallen over the past month.
- Values from 0-2 represent a flat month stock trend, up to 9-10 for an excessive price trend.
Intermediate Trend
- A longer-term indicator which looks at the latest 4-month stock trend.
- Generalizes:
- Extreme rallies and pullbacks
- Possible tops or bottoms
- The start or continuation of an intermediate rally or pullback
Support/Resistance
- Is the stock price at a support or resistance area?
- The nearest support area below and resistance area above the stock price.
Disclaimer: This is NOT investment advice, just general help and opinions. Please check with a registered investment
advisor before making any investment decisions. This
document may contain errors. Chapman Advisory Group LLC employees are not investment advisors. Please review:
https://www.stockconsultant.com/disclaimerpage.html

