Trading Guide - Chapter 4
 Contents
Topics
Support and Resistance
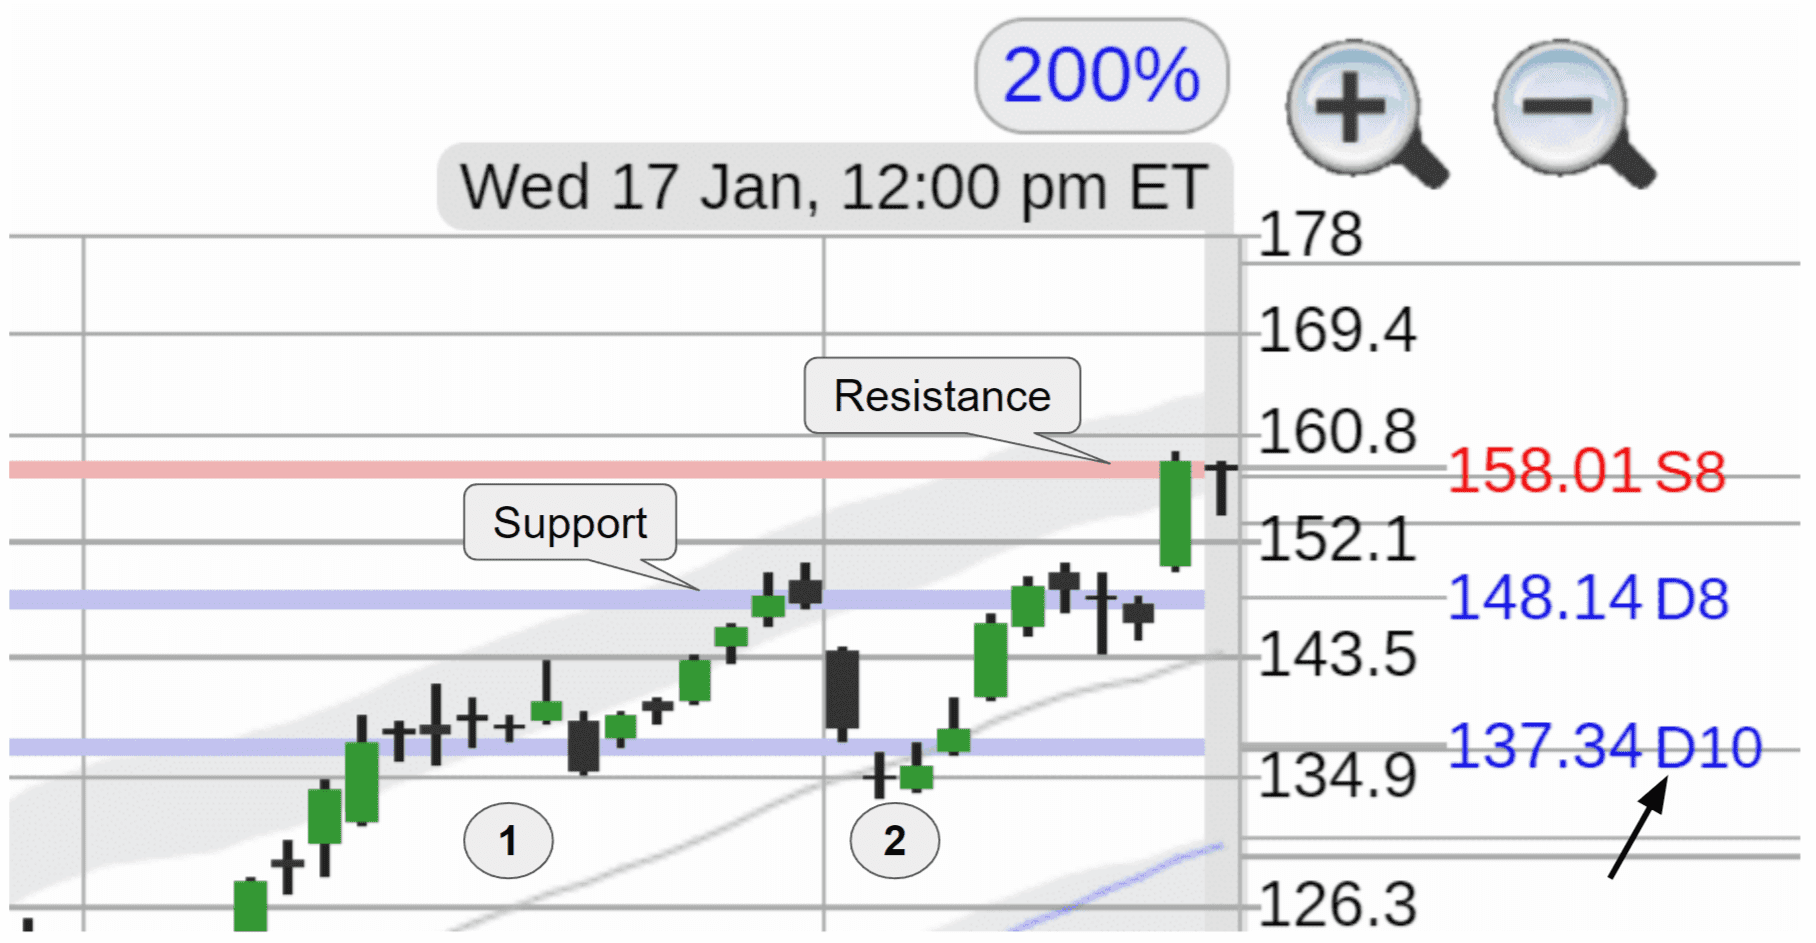
- A price area that offers protection against further declines is known as stock support, located at or below the present price. A stock may pull back to support, shown as blue lines on the 8 month chart.
- A price area at or above the present price that acts as resistance to any upward movement is known as stock resistance. The stock may rally to resistance, labeled as red lines on the 8 month chart.
- Grey lines on the 8-month chart represent a neutral "support or resistance" price level that offers both support from downward movement and resistance from upward movement.
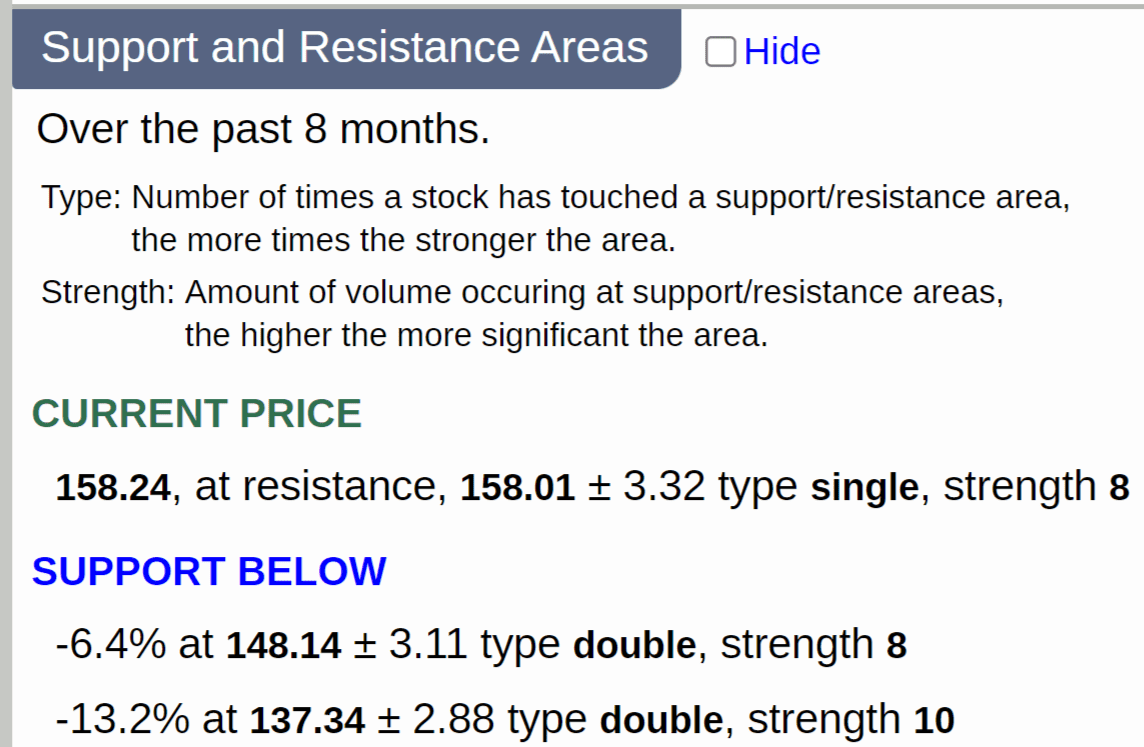
- The support/resistance comprises price, type, and strength.
- Support and resistance areas have a (+ and -) width in stock points.
- The number of times a stock has bounced off support or rejected resistance areas over the last eight months—single = one time, double = two times, triple = three times, triple+ = more than three times—denotes the type of support and resistance. The more times, the more significant the support or resistance area.
The categories are denoted S, D, T, and T+ on the stock chart and range in strength from the weakest single (S), double (D), and triple (T) to the strongest triple (T+).
- The strength of each area ranges from 1 to 10. This number represents the
total stock accumulation or distribution volume.
- Support and resistance areas created with light distribution or accumulation volume have strengths ranging from 1 to 3.
 Double support example

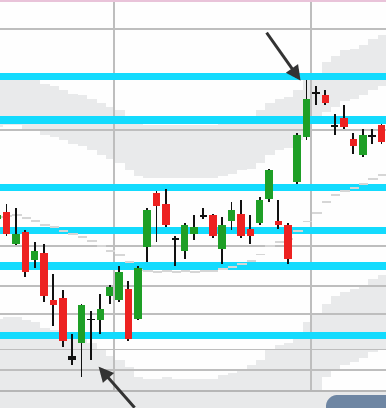
- Stock tops with high volume can create strong resistance (type single) with a strength of 8 to 10 (high distribution), and if a stock revisits that top on a future rally, it will provide a substantial resistance area.
The same holds for establishing a stock bottom (type single support, strength 8 to 10, high accumulation), when revisited on a subsequent pullback.
- Following a good stock rally (short-term direction 7+), a resistance area will have a more significant impact.
- A stock must have strength at the start of a rally to break through the local resistance area. On the 5 or 10 day real-time chart, traders could hold off until they see a local price breakout.
- The significance and intensity of the support will increase following a substantial pullback.
- A stock may exhibit very choppy (up and down) price swings when there are closely spaced support or resistance areas (one support or resistance after another). It should be treated as one support or resistance area in these cases.
- Over time, stock support and resistance areas change and are dynamic. It is essential to remain flexible and establish rules to effectively navigate and address changes in stock support and resistance areas over time and the identification of new support and resistance areas.
8 Month Chart Rally Bands
- A stock may go up or down to the area of the shaded Rally Band before reversing course or consolidating.
Indicators
Quote
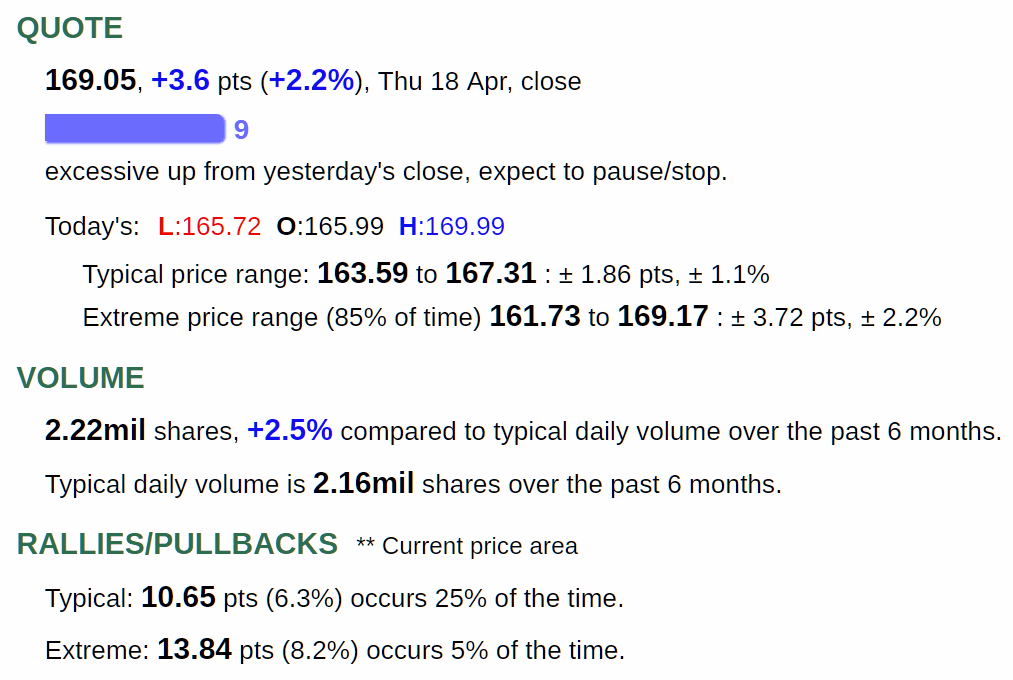
- It is easy to ascertain whether an intraday price change has been excessive and whether the day's peak or bottom has been reached by comparing typical and extreme price ranges.
Volume
- The number of shares traded in relation to the typical volume for that time of day. The daily volume at the end of the day is compared to the previous six months.
- On the 8 month chart, you can find the typical volume indicator line.
- Using a proprietary algorithm, typical volume eliminates days with high and low volume that could distort the reading.
- Early in the trading day, high volume could support dip buying at support areas or help confirm breakouts.
Rallies/Pullbacks
- The expected normal and extreme rallies (in percentages and stock points) that momentum trades may experience from support at the current price.
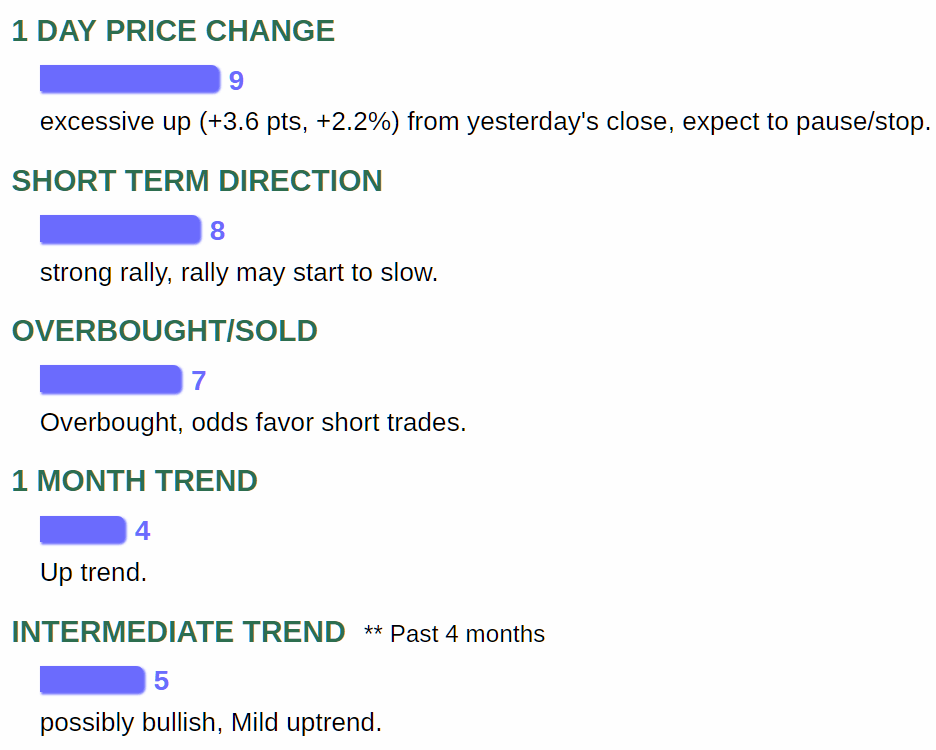
1 Day Price Change
- This helps avoid chasing a stock higher on the day you might wish to add a long position.
- A value of -9 or -10 signals a significant intraday move and a potential long opportunity for intraday traders; a reading of +9 or +10 indicates a possible short opportunity.
- Screening for extreme intraday 1 day price movements is possible.
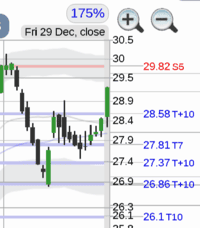 Extreme 1 day price change

- An excessive single-day price move or gap up or down (levels 9–10) is rare and may not continue for another day. A strong stock will pause or keep most of its gains the next day.
- On the day you want to add a position, use this indicator to avoid chasing a stock upward (for longs) or downward (for shorts).
- When the market is generally down, a strong up reading (4+) may be a sign of strength and could be utilized as a screening signal.
Short Term Direction
- A short-term indicator that captures three-day to three-week stock market rallies and declines. (Note: Longer rallies and pullbacks lasting one to three months are identified by the overbought/sold indicator.)
- Consider taking profits on a long position after an extreme rally (9-10).
- A pullback signal for entries on momentum (with trend) long trades.
- It assists in avoiding entering a trade following a strong or excessive rally (8+).
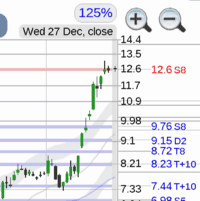 Extreme short term direction rally

- Levels 9 to 10 represent an extreme rally or pullback (-9 to -10) that is uncommon, might not last in the near term, and can be used as a signal to add short positions, tighten stop limits, or take profits on longs.
- When the short-term direction is used with the stock portfolio sector listing, one can determine whether the whole sector has completed a strong rally or pullback.
- It usually takes longer for stocks with significant pullbacks that are also highly oversold to recover than those with ordinary pullbacks. However, big rallies can quickly reverse following bearish confirmation, such as the formation of resistance and a bearish 3 day chart.
- Large opening gaps in price—either upward or downward—might not be filled for two to three months.
- The market does not always follow bell curve statistics. You might want to consider "wait for confirmation" (bullish 3 day stock chart, at support, 1 day money flow action, etc.) for pullbacks before going long because sometimes a significant pullback (7 to 8 range) continues to the extreme. Some traders will wait for breakout confirmation of the local support area shown on the 5 or 10 day intraday chart.
Overbought/sold
- A medium-term indicator measures a one to three-month-long stock uptrend and signals whether it is overbought (or oversold for a one to three-month pullback).
- Be cautious when entering an overbought breakout trade.

- Month-long rallies or pullbacks can cause extreme overbought or oversold values in the 9 to 10 range.
- Although month-long rallies might be overbought, a stock breakout could increase stock prices even higher. Watch the breakout indicator if the overbought position continues (occasionally to new highs, dangerous).
- Extended pullbacks (1 to 3 months) that cause an oversold signal may take longer to turn around and rally. Sometimes, it takes twice as long, up to two or three months for a 1 to 3 week short-term rally from this oversold area.
1 Month Trend
- A short-term indicator that looks at the rate of change in the stock price over the previous month (slope).

- Extreme month trend ratings of 9 or 10 rarely continue for another month.
- You can use a flat month trend for determining and screening intermediate-term (multi-month) stock tops and bottoms.
- Following a flat month trend, bottom breakouts may have a greater chance of success.
Intermediate Trend
- A longer-term indicator that examines the most recent four-month stock trend.
- Uptrend signal for entries on momentum long trades.
- Screen for the beginning of an intermediate trend higher.
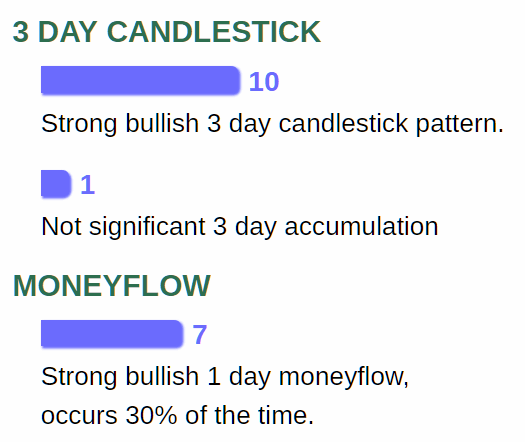
3 Day Candlestick
- More than 120 candlestick patterns are analyzed by the 3 day candlestick indicator.
- It best determines the start of stock rallies off support areas and pullbacks from resistance areas.
- Patterns ranked as neutral (0), mild bullish (+5) and bearish (-5), strong bullish (10) and bearish (-10)

- Neutral 3 day candlestick patterns appear before a rally or pullback.
- Neutral to bullish 3 day candlestick patterns appear before breakouts.
- Strong bullish 3 day candlestick patterns mark the end of a strong pullback or gap down.
3 Day Accumulation
- A bullish 3 day candlestick pattern's credibility is increased by strong 3 day accumulation.
- Strong accumulation at the start of a breakout increases the odds of a follow-through.
- When a stock pulls back, an extreme accumulation reading of 9 or 10 may indicate a stock bottom.
- A stock top may happen during rallies if the extreme 3 day distribution reading is 9 or 10.
MoneyFlow (1 day)
- A short-term indicator that measures the 1 day money flow compared to the previous six months.
- The end of a rally or pullback may have an extreme 1 day money flow reading of 9 or 10.
The public typically responds to late news or an upgrade at the top (a downgrade at the bottom) with significant money flow.

- Good to extreme bullish 1 day money flow (6-10 level) may be used to confirm the start of a true breakout (for breakdowns, use bearish money flow).
Good to extreme money flow may also confirm the continuation of the current up or downtrend.
- A stock rally or decline may not succeed if there is no visible rise in money flow or volume within a few days following the movement.
Disclaimer: This is NOT investment advice, just general help and opinions. Please check with a registered investment
advisor before making any investment decisions. This
document may contain errors. Chapman Advisory Group LLC employees are not investment advisors. Please review:
https://www.stockconsultant.com/disclaimerpage.html
