Trading Guide - Chapter 3
 Contents
Topics
Real-time Charts
- Intraday real-time charts work well to determine where local support regions are and modify trade entries or trailing stops.
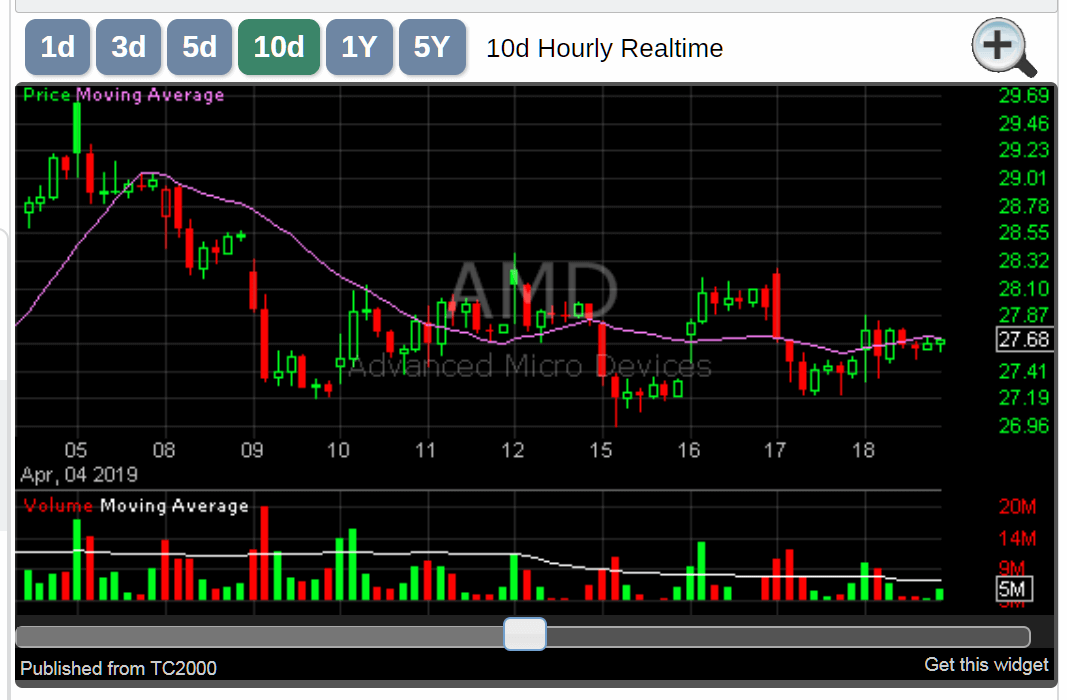
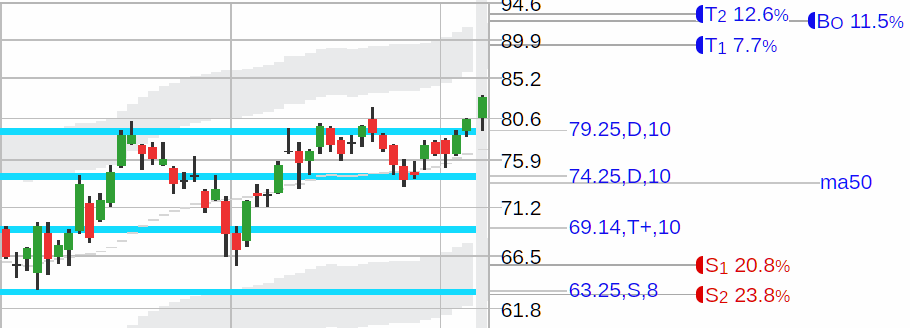
- On the 10-day intraday real-time chart, the minimum price action range is 26.96. It could be possible to put stops below this range.
- Determine the price range of the support area using the 5 or 10 day real-time intraday chart.
This price range is used for a long entry at the local high price breakout or near the low for a tight stop and increased profit to loss ratio.
Real-time Chart Overlay
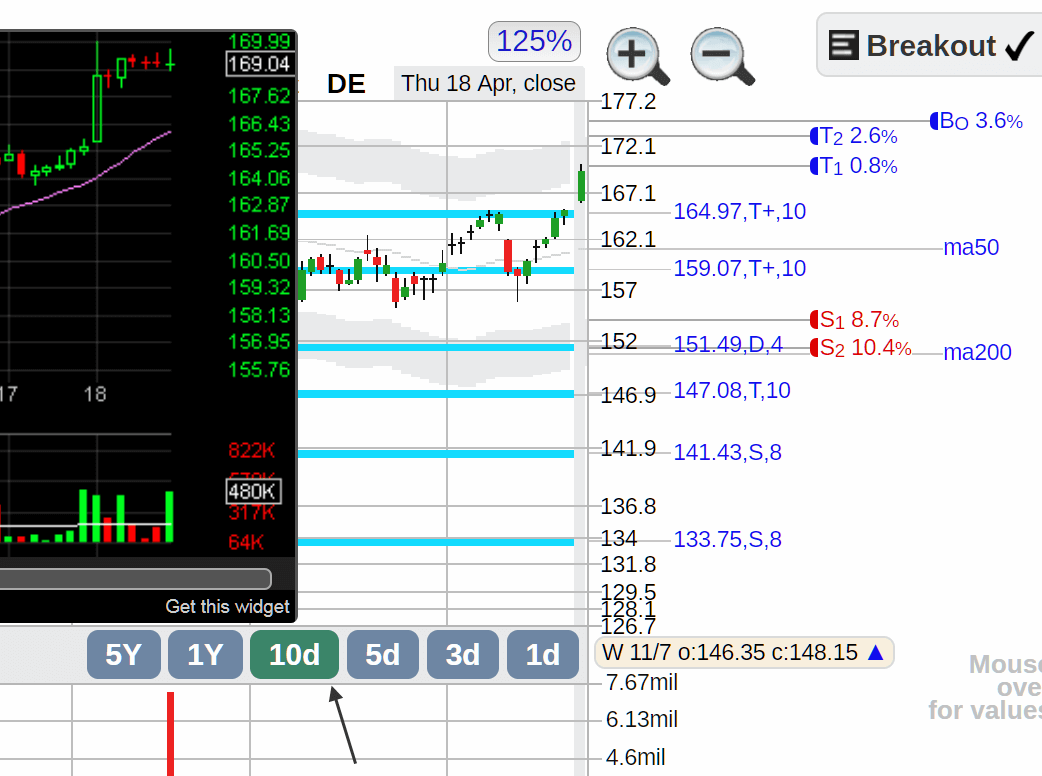
- Recognise fast breakouts at open.
- Examine the daily candlestick formation, buying and selling volume, and intraday price movement.
Stops And Trailing Stops
- The best stop price is below support, invalidating the trade if hit.
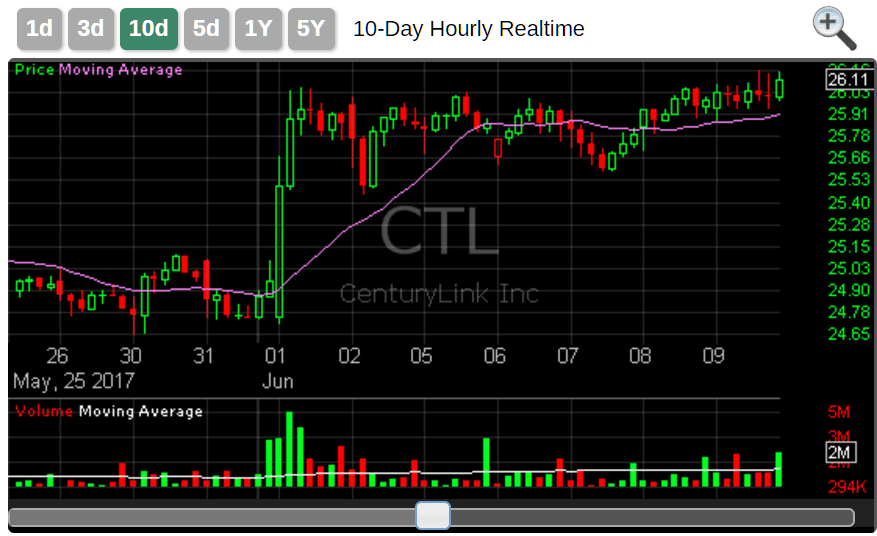
- To fine-tune a stop, use the 5 or 10 day real-time intraday chart to gauge the entire price range of the short-term support area.
- In the above 10 day chart (a continuation breakout watch), the 25.5-25.6 area would be considered a support area, with a stop placement at or below 25.4.
- Price movement for a trailing stop should only be upward.
- At the beginning of a trade, the StockConsultant will keep stops wide and tighten the trailing stop as the stock rallies. Following a strong rally, a stock may form a small resistance area and permit a tight stop.
- Tighten stops once a day in the morning unless it is a very active stock with a significant move during the day.
Trade Tips

- Maintain a 3:1 or higher stock profit/loss ratio (P/L). If a stock has a price target of Target 1 (or T2) at 12% profit, the maximum stop loss (stop) would be 4% for a P/L ratio of 3:1. If a tighter 3% stop is available, the P/L ratio would be 4:1. A diversified stock portfolio with ten positions and a P/L ratio of at least 3:1 allows you to break even with only 33% correct trades.
- Look for stocks with a minimum 5% or higher target profit.
- Aim for a 30% or higher profit on inexpensive stocks priced under $5.
- 9 to 15% represents the sweet spot for profits on medium-cap equities.
- Price and breakout targets can be on the low side, especially if over the past year the stock has had only one or two big rallies or pullbacks (low volatility or movement). The price and breakout targets are more accurate the more rallies and pullbacks (volatility or movement) there have been over the past year.
- To fine-tune trade entries and trailing stops, use the 3, 5, or 10 day real-time intraday chart.
- Optimal trades are limited to a small price range. Tight stops, maximum T1 and T2 target profits, and high trade quality areas occur at support.
- Avoid chasing stocks; instead, utilize support to enter the market ahead of the crowd. Be disciplined in each trade by using a straightforward setup.
- Watch out for false breakouts—research indicates that taking the second attempt at breaking through may be more likely to succeed.
- A failed breakdown at a bottom support area may provide a good long entry.
- It is advisable to wait for some stability and double or triple support zones to emerge before looking for trade setups after a considerable price gap down (or several large down days, i.e., falling knife). This process can take one to three months.
- Trade cycle: entry on bullish indicators with an initial stop; stock rallies with fewer bullish indicators use a trailing stop; exit or tighten stops at T1/T2 targets or a short-term overbought resistance area.
- Greater capitalization and more expensive stocks typically have profit targets of approximately 5%, but riskier stocks (less than $10) usually have up to 30% or more profit targets.
- Determine whether it is worthwhile to trade a cheap stock (under $10) for a mere 5% profit; modify the screen.
- Reduce the chance of losing money on stocks with large profits and greater stop-loss levels. Example: A $100k portfolio with up to ten $10k stock positions, a 15% profit target, 5% stop loss, and a 3:1 P/L ratio would result in a profit of $1500 or a loss of $500.
If a stock is under $10 with a 30% profit target and a 10% stop loss (3:1 P/L ratio), the possible loss may be twice as large, or $1000, on a $10k position. This might be an intolerable level of loss. To mitigate the higher risk, reduce the amount of the stock position to half at $5,000. Normalize the loss to be the same as a typical trade and yield the same profit. With the StockConsultant ReCalc tool, you may modify this.
Trade Clean Looking Charts
Noisy Chart
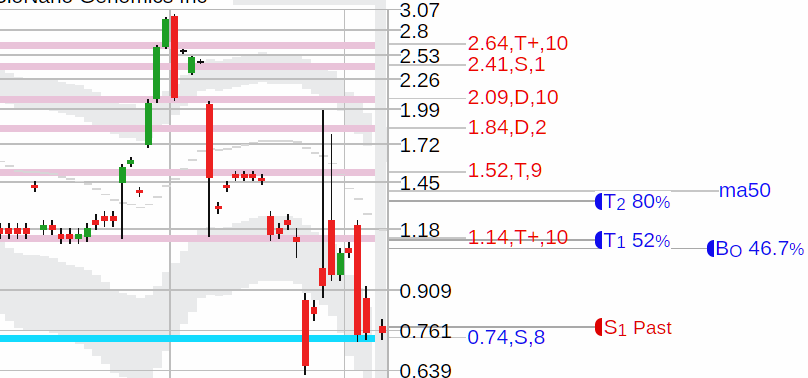
- Many price gaps can be seen in low price, low volume, or foreign stocks trading on US exchanges.
- Price action is difficult to interpret.
Clean Chart
- Few price gaps.
- Support and resistance regions are clearly visible.
- Easy-to-read price action.
Email/Text Alerts
- Look for a brokerage or service that will save stock price alerts and notify you by text or email when the stock crosses that price or falls below it.
- Schedule alerts to go off when a stock hits a support level or right before a breakout level.
Stock Options
- Use options instead of buying stock to limit the risk of significant loss or to avoid the "I got stopped out, then the stock goes your way" because of noisy price action or a temporary overnight/open gap down in price.
- Option basics video
- Options trading for beginners
- Options trading basics
- Option long call
- For instance, you would purchase a call option for the same amount if your stock stop loss was $300, or 3% of your $10,000 investment. Your maximum loss (risk), regardless of how much the stock declines, would be $300.
- With options, you may profit 70% ($210) to 400%+ ($1200+) on a strong breakout (or momentum/bottom long rally), putting less cash at risk than if you held the stock outright.
- Options expire after a week, one, two, or more months. The stock will expire worthless, and you will have lost $300 if it does not increase above your option strike price by the time it expires. A level-based loss is replaced with a time-based loss.
- Options let you worry less about very short-term stock movements. Expiration dates should be 1.5 to 3 months out (vs. a month or less), leaving more time for cases when the breakout or momentum/bottom trade takes longer to develop or fails and then makes a comeback.
- With options, you cannot stop out with a large loss. If bad news occurs overnight and the stock opens with a gap down, in our example, the maximum loss you can incur is $300. However, for owning a $10k stock position, this potential loss could be much greater (up to $10k loss).
- Look for stocks that can hit the breakout or price target T1 or T2, with good option profits, before the expiration date (make sure to pad a little extra time for option expiration).
- Options around impending news and earnings are best avoided as they are more expensive and can result in low option profit at target and a low profit/loss ratio.
- Stay away from low-volume stocks with wide option buy (ask) /sell (bid) spreads (these will have low option volume). Buying an option at the ask, you immediately lose 30% selling at the bid. Larger stocks and ETFs/indexes have better pricing on options with higher option volumes and narrower spreads.
- You should apply the same stock profit/loss (minimum 3:1) guidelines to options.
Disclaimer: This is NOT investment advice, just general help and opinions. Please check with a registered investment
advisor before making any investment decisions. This
document may contain errors. Chapman Advisory Group LLC employees are not investment advisors. Please review:
https://www.stockconsultant.com/disclaimerpage.html
