Trading Guide - Chapter 2
 Contents
Topics
Momentum (with Trend) Long Trade
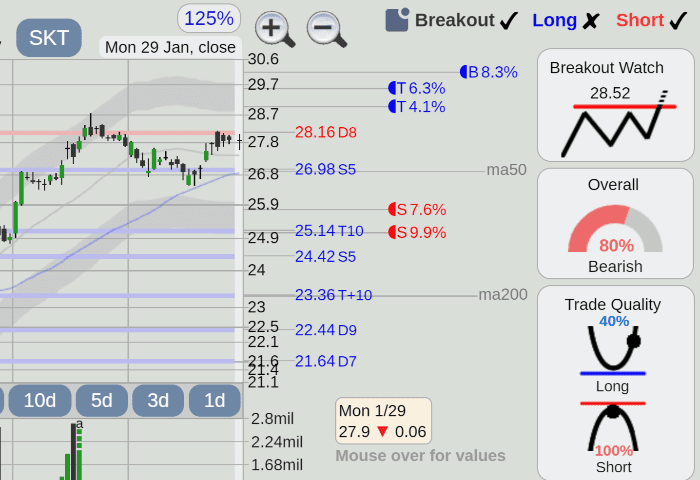
- Momentum (with trend) long trades use the overall and trade quality indicators.
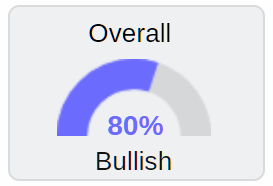
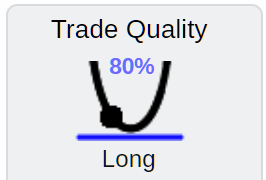
- A good long trade setup has an overall indicator => 65% and trade quality => 70%.
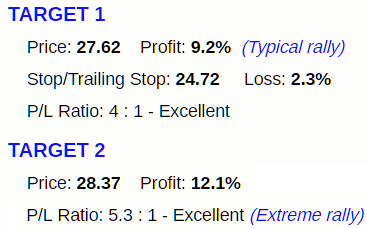
- The long trade detail provides targets T1 and T2 (for an extreme rally), stop, P/L (profit to loss) ratio, and rating (excellent for a P/L of 3 or greater).
- A momentum trade usually takes one to four weeks (5 to 20 trading days) to reach its target.
- The long target accuracy is higher when numerous rallies and pullbacks (volatility or movement) occur over the past year
and more conservative if there have been only one or two significant rallies or pullbacks in the stock during the previous year (little volatility or movement).

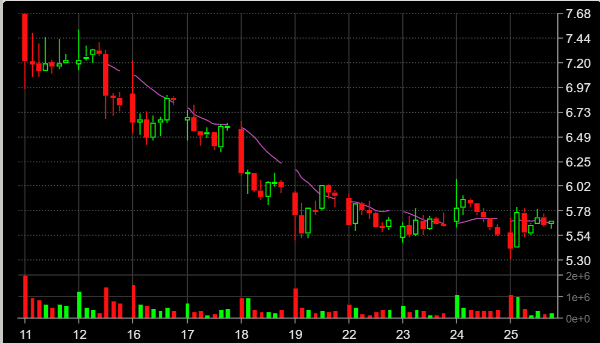
- Volume trends lower, and the 3 day candlesticks shift from bearish to neutral or positive as a stock pulls back to support.
- The price downtrend on the 10 day intraday chart begins to level off.
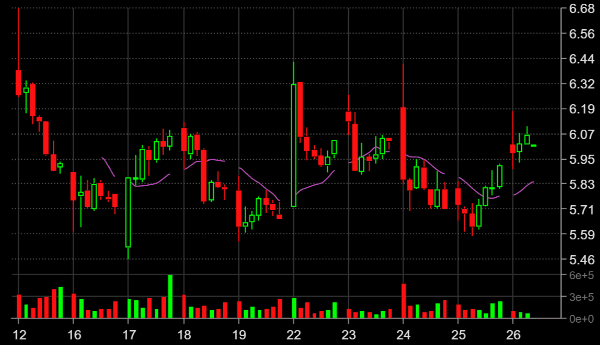
- The 5 or 10 day intraday chart shows a limited price range at support that is ideal for trading.
- While some traders enter trades around the bottom of the support area with a tiny stop and a high profit/loss ratio, others wait for an upside breakout of the support area with a higher stop loss and lower profit/loss ratio.
- At the beginning of a rally, there can be a lot of uncertainty, so make your initial stop as wide as possible.
- At support, there are high trade quality and profit/loss ratios (maximum profit and small stop loss).
Long Trade Action
Overall Indicator
This indicator represents the overall picture for the past 2 to 4 months. A mild bullish reading of 65% or above is necessary for momentum and bottom trade entries.
- Stock prices are in an uptrend.
- Having a good positioning without being overbought.
- A normal short-term pullback to support for an optimal long entry.
Trade Quality Indicator
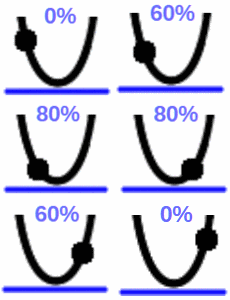
- The blue line denotes support, while the black dot shows the direction of the price movement.
- The trade quality is a short-term (1 to 2 weeks) entry indicator. Long momentum and bottom entries require a high trade quality of 70% or more.
- High trade quality characteristics:
- Near or at support
- Tight stops
- Good target profit
- Good target potential, a low number of resistance areas to the target.
- The highest trade quality (90 to 100%) happens in a narrow price range with the tightest stop and maximum trade profit.

- Stocks in an extended two-week+ narrow price range can have high trade quality for long and short trades. To determine whether to enter a long or short trade, consider other indicators such as bullish money flow, candlestick patterns, and the overall trend.
Trade Quality Cycle
- When a stock pulls back to a support area, the trade quality's black dot, which shows price movement, will travel down the left side, from 0% (falling price; low trade quality) to 60%, and finally to the 70–100% support area with the highest trade quality (the blue line indicates support).
- When the stock rallies off support, the trade quality's black dot will travel up the right side, from the 70 to 100% support area to 60% to 0% (rising price, far from support, poor trade quality).
Bottoms
- It is advisable to hold off on looking for trade entries until some stability and double or triple support areas appear following a considerable price gap down (or numerous significant down days, i.e., falling knife).
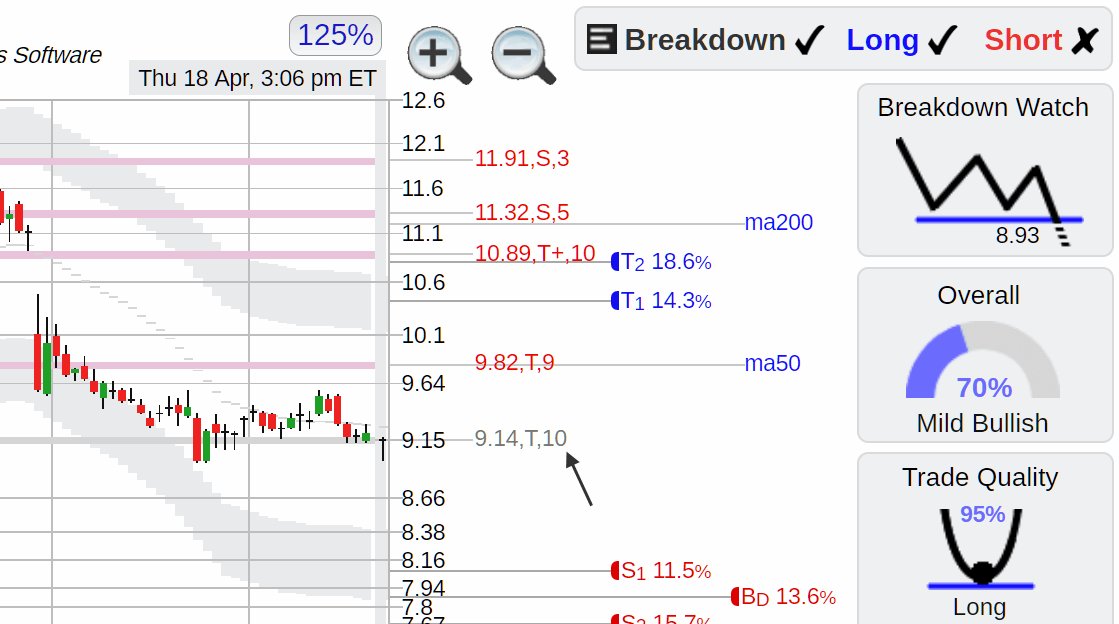
- Since there may also be a breakdown watch, bottom long trades at single, double, or triple support regions might be risky.
- Failure to hold support will result in a breakdown to even lower prices.

- A stock may take one to three months to level off, form support areas, begin trending higher, and break out into the prior price gap.
- A failed breakdown (price initially breaks down and then returns) in an established bottom area can cause a strong price reversal and upward trend change. One could screen for breakdowns and look for failures for long entries off the bottom.
Long Trade Tips
- Traders can use a trailing stop limit to lock in profit by adjusting it daily to be below the stock price local support area (3 day intraday chart) as it moves higher. Eliminates the need to decide "When do I sell?" while maximizing short-term profit.
- When strong double or triple resistance areas are halfway between the current price and Target 1, the stock's potential for Target 1 decreases dramatically.
- Short-lived, strong rallies have the potential to surpass Targets 1 and 2. Stocks that are slowly trending—targets 1 and 2—will rise in tandem with the trend.
- Traders usually leave stop limits loose when going long at the beginning of a rally and tighten them as the rally progresses.
As the rally proceeds, tighten the trailing stop. We should set a tight stop limit to lock in a good profit if the stock hits Target 2 (extreme rally and/or overbought).
- Watch out for opening price gaps that could hit your stop and steal your shares.
- Tighten the stop limit following three days of little to no change in the stock price.
- Tightening the trailing stop is an intelligent idea if a stock has a strong rally followed by three days of little price movement.
A resistance region will form after three days, and a drop may be imminent if the stock does not try to move higher.
- If, after three days, no strength is observed when buying stocks that have pulled back to support, the stock can be in danger of declining further. To reduce the loss, tighten the stop.
- On a day when the market is down, screen for rising stocks to give you some idea of which stocks or stock types and sectors are strong.
Breakouts
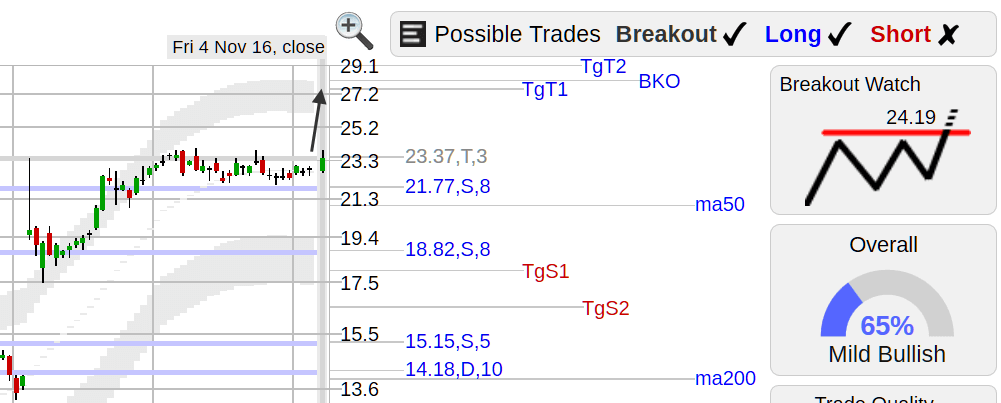
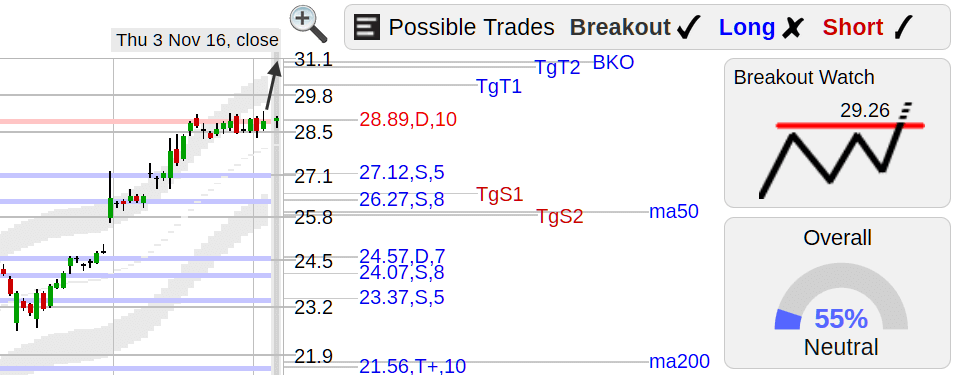
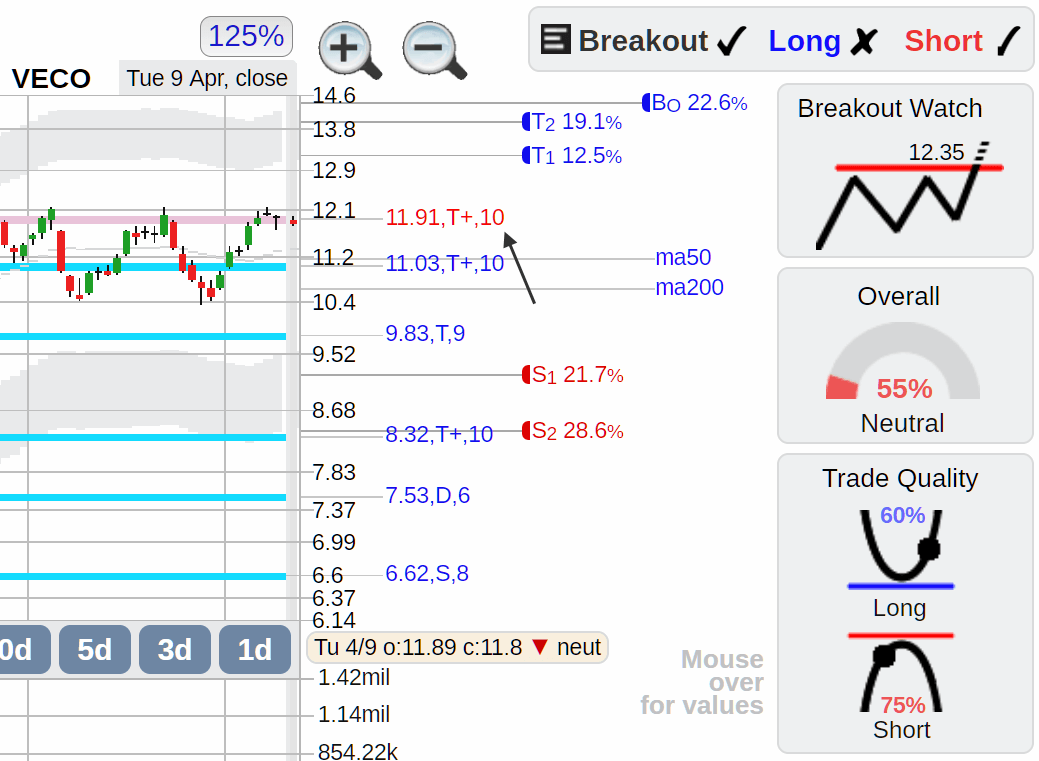
- When the stock price passes through a resistance area, a breakout can happen if there is an upside price gap, a much higher resistance area, or no resistance above (new high area).
- The red line on the breakout indicator denotes a resistance area and price breakout level. The stock price will have confirmed a breakout if it rises above this level.
- When the price surpasses the breakout level indicated on the indicator, the stock may experience a rapid rally, as there are no resistance areas to impede its progress.
- The overall trade quality can be high for a bottom breakout or a flat top (narrow price range) breakout.

- The breakout trade provides a price target, stop, profit to loss (P/L) ratio, and rating (excellent for 3 or greater profit to loss).
- The details of the long trade and breakout are separate.
- This is a short-term event; it usually takes a breakout trade one day to one week (5 trading days) to reach the target.
- The breakout target accuracy is higher when numerous rallies and pullbacks (volatility or movement) occur over the past year
and more conservative if there have been only one or two significant rallies or pullbacks in the stock during the previous year (little volatility or movement).

- Use the 5 or 10 day intraday chart to fine-tune your breakout level; look for prices slightly above the resistance area's price range.
- Before a breakout, you might be able to go long at the local support area.
- Because breakouts occur at resistance areas and close to highs, there may be a lot of bearish indicators and an excellent short entry.
Breakout Types
The most reliable breakout patterns:
- Short run
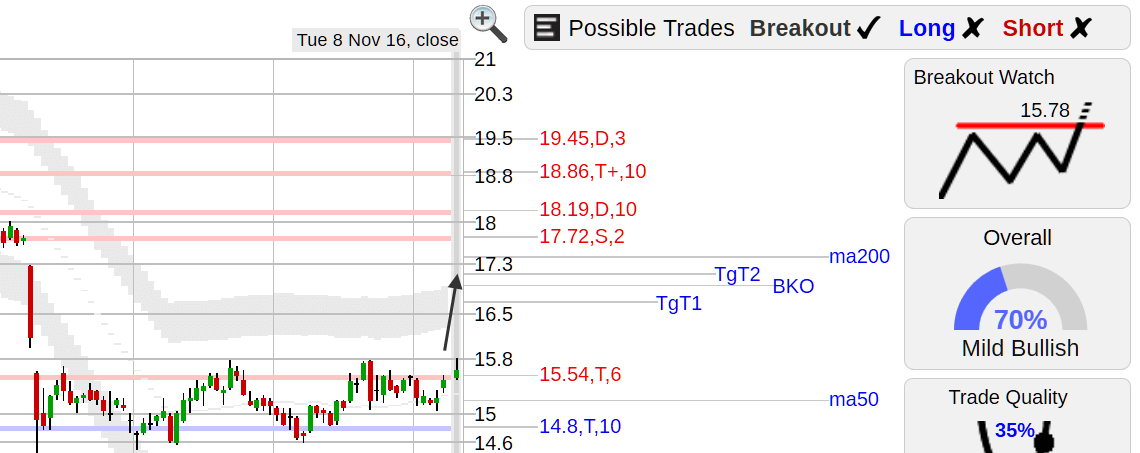
- Narrow price area
- Flat top (bull flag)
- Bottom
Short Run Breakout
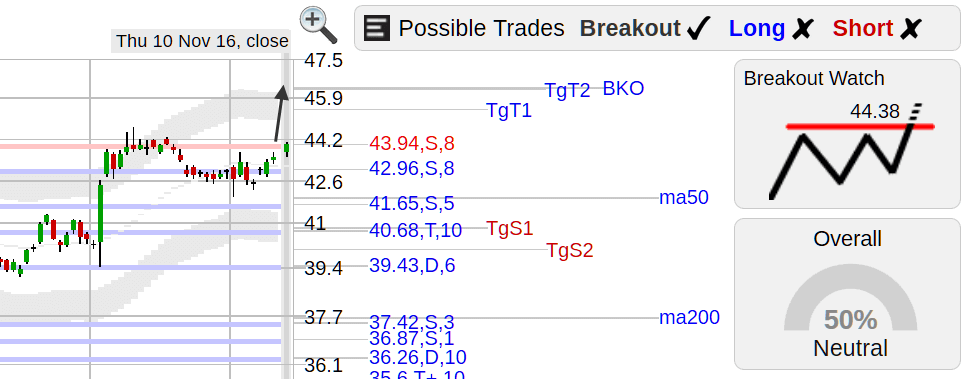
- The rally is just beginning (short-term direction is up), and there may be an increase in volume.
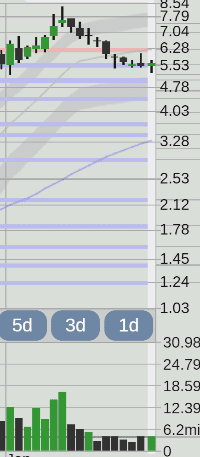
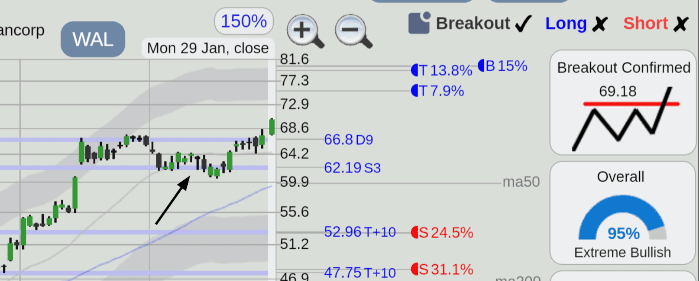
- Important support is nearby at 42.96.

A high trade quality long trade may be available at 42.96 support.
Narrow Price Area Breakout
Flat Top (Bull Flag) Breakout
- Flat top (bull flag pattern) breakouts have clearly defined breakout levels and stops.
Bottom Breakout
- Large upside price and resistance gaps are possible for bottom breakouts.
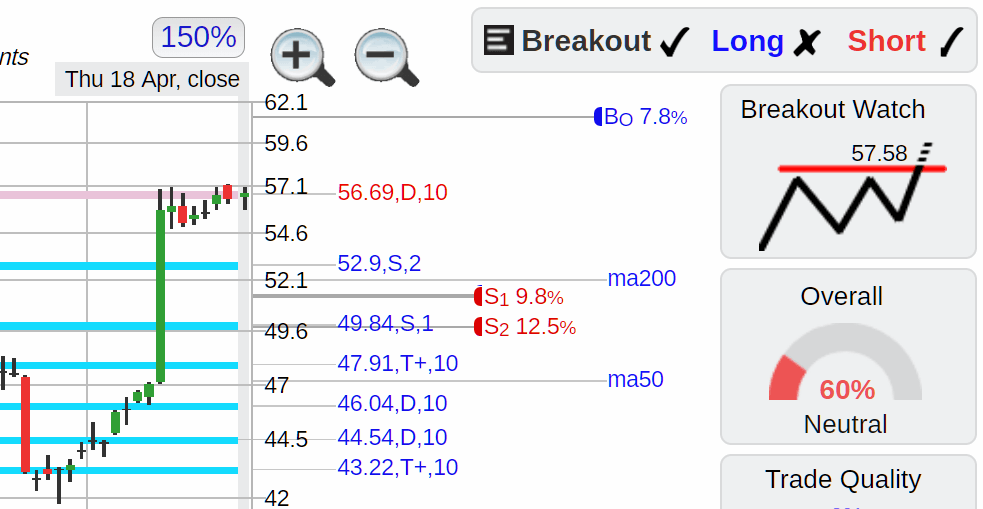
Run Up Breakout
-
The run-up breakout watch is the least dependable breakout. The stock has already rallied (with strong or extreme short-term direction), and before making another breakout move, it must now consolidate at resistance (56.69). A bull flag could form due to the consolidation before another breakout.
-
Price movements and indicators that undermine breakouts:
- Overbought indicator: a 7 or higher; the stock has already had a strong 1 to 2 month move higher.
- Intermediate Trend: A stock has been in a strong uptrend for at least four months and is not sustainable.
- Short-term direction: strong to extreme; a large 1 to 2 week rally has occurred.
- Exhaustion of the present breakout could result if there were recent breakouts with high volume within the previous month.
- Be aware of failed breakouts; some studies suggest taking the second breakout attempt has more success.
Narrow Range Breakouts And Support
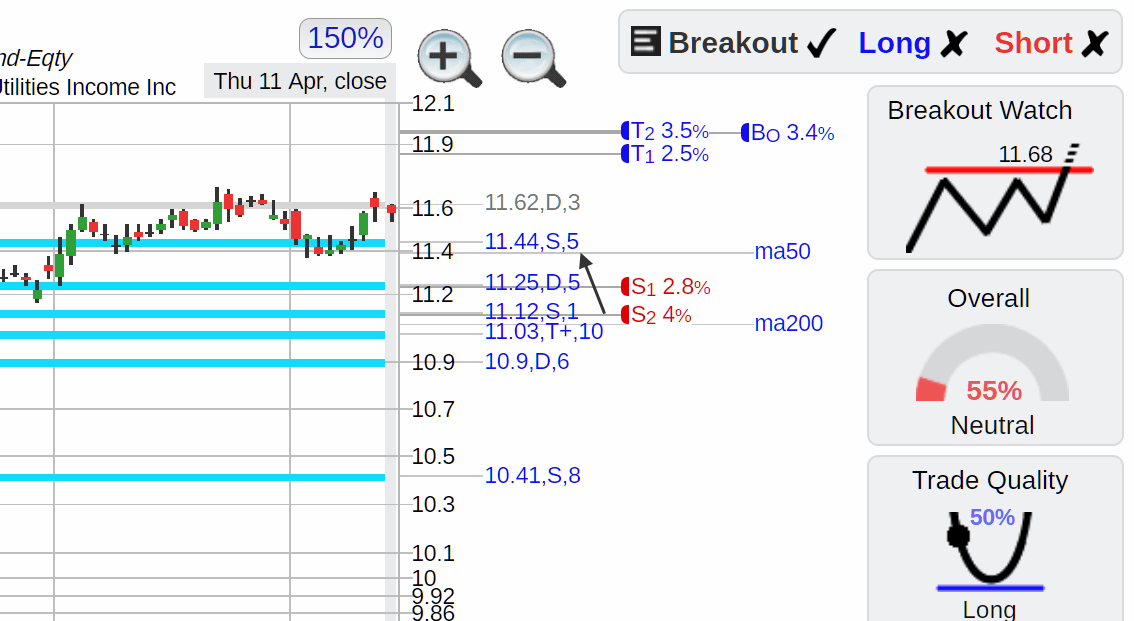
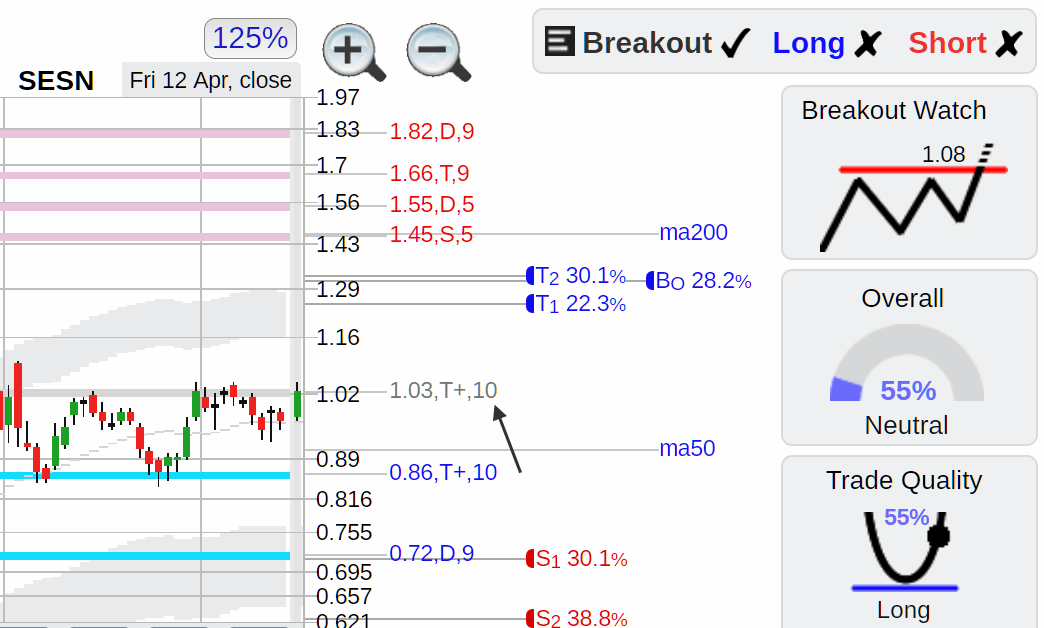
- At support of 11.44, a pre-breakout high trade quality long trade might be possible.
- High trade quality longs in the lower support area could coincide with narrow range breakouts.
Breakout Trade Action
Breakouts and Short Trades
- Breakouts happen at resistance areas and may also have good short trade setups.
- A failed breakout (price initially breaks out and then returns) may be a great short trade setup.
Breakout Trade Tips
- Stock watch breakout types have yet to rally but have higher profit/loss ratios (more profit potential with tighter stop limits). If one looks at the 3, 5, or 10 day intraday stock chart, one can observe accumulation and enter a long position in anticipation of a confirmed breakout.
If one does enter long and three or more days go by without a breakout, tighten the stop to protect against a pullback.
- Although confirmed breakouts may be more likely to continue, they may also have lower profit/loss ratios (lower profit with looser stops). Look for significant buying volume on the 3, 5, or 10 day intraday stock chart (as well as strong bullish 1 day money flow) at the beginning of the breakout to help avoid failed breakouts.
- Watch out for breakouts that consist of a single high-volume day followed by several low-volume days and no price follow-through. If this happens, tighten the stop to lock in a gain or break even.
- When stocks are overbought, they may break out even higher.
- The end of a breakout rally (top) may occur on a day with high volume (high 1 day money flow) but flat price movement.
- Screen for watch or confirmed breakouts to give you some idea of which stocks or stock types and sectors are strong.
A Stock Trading System
- Stock trades with high profit/loss ratios of at least 3:1 and diversification into 8 to 12 positions, with no more than two stocks in the same type or sector, can be the foundation of a successful trading system.
- Because of the high profit/loss ratio and diversification, you only need to be right 33% of the time to break even. Based on a typical 15% profit, 3:1 profit/loss ratio, 5% stop loss, and diversification into ten positions with a constant stop loss amount.
- Reasoning behind constant stop loss amount is to reduce risk: if you trade $50k over ten trades ($5k per trade) with a profit of 15% and stop loss of 5% (3:1 profit/loss ratio), your profit will be $750 (0.15x5000) or loss of $250 (0.05x5000) per trade.
If you find a higher-risk stock that has a 30% profit and requires a 10% stop loss (3:1 profit/loss ratio), you will lower the trade amount to $2.5k (from $5k) for the same profit of $750 (0.3x2500) and loss $250 (0.1x2500).
- Use half the trade amount if doubling the stop loss. Use one-third of the trade amount if tripling the stop loss.
- The Upside Recalc tool (Consultant page) can help keep a constant stop loss risk, set the base stop loss % and trade amount, and let the tool calculate the risk trade amount and number of shares.
- Selecting stocks with even higher profit/loss ratios and raising your stop (trailing stop limit) to at least breakeven once a move occurs may make it such that, on average, you only need to be correct 16% of the time to be profitable.
- Your long-term gain depends less on how accurately you make trade decisions when you have a solid stock trading system; the deck is stacked in your favor.
Disclaimer: This is NOT investment advice, just general help and opinions. Please check with a registered investment
advisor before making any investment decisions. This
document may contain errors. Chapman Advisory Group LLC employees are not investment advisors. Please review:
https://www.stockconsultant.com/disclaimerpage.html






 A high trade quality long trade may be available at 42.96 support.