Trading Guide - Chapter 1
 Contents
Topics
Prerequisites
This guide will concentrate on the long trade setups.
It would help if you had a basic understanding of technical analysis, price action and candlestick charts.
Candlesticks
Stock support and resistance
Stock volume
Basic chart patterns
Stock trade basics
Trade Cycle
Momentum stock at support
- Enter trade with bullish indicators (bullish overall, high trade quality) at support with an initial stop.
- As the stock rallies use a trailing stop, fewer bullish indicators will exist.
- Exit or tighten stops at targets T1/T2 or at a short-term overbought resistance area.
Breakout Trade
- Enter the trade above the resistance area and breakout price level.
- Use trailing stops when the stock breaks out.
- Exit the trade or tighten the stop at the breakout target or a newly formed overbought resistance area.
Dynamic Indicators
- Indicators from StockConsultant are dynamic and constantly changing.
- Because support levels fluctuate, long entries at support constantly change.
- Indicators will be bullish for long entries within a narrow price area and less outside of it.
- Breakouts are impacted by changes in resistance areas or the distance between them.
- When the stock price comes close to the breakout area, the breakout watch/confirm indicator appears; when the price moves above or below this area, it disappears.
Trade Types
- The StockConsultant is useful in finding three types of long trades:
- Momentum (with trend)
- Bottom
- Breakout
- Momentum (with trend) and bottom trade entries are at or near support areas.
- When the stock moves above the resistance area and breakout price levels, it triggers a breakout trade.
Trade Timeframes
- A long momentum or bottom trade often takes one to four weeks (5 to 20 trading days) to reach its target.
- A breakout trade typically takes one day to two weeks (5 to 10 trading days) to reach the target; this is a short-term event.
Trade Profit Expectations
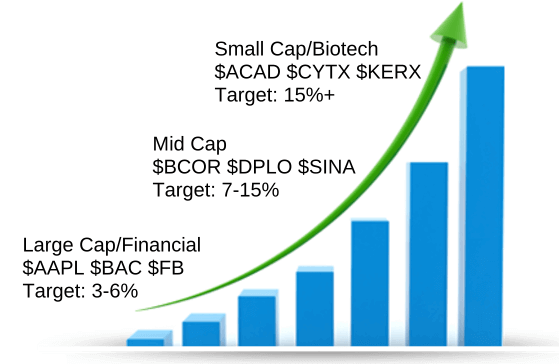
The size, sector, and industry of a stock correspond with long momentum and breakout trade profit.
- Lowest profit: 3 to 6% on large caps (price 25+, volume > 1 million), conglomerates, banks, and technology stocks.
- Medium profit: 7 to 15% on mid-cap (price 12+, volume 300k-1Mil), fast-growing technology, and medical stocks.
- High profit: 15 to 30% (with significant risk and volatility) on biotechnology and small-cap companies (price <12, at any volume).
Disclaimer: This is NOT investment advice, just general help and opinions. Please check with a registered investment
advisor before making any investment decisions. This
document may contain errors. Chapman Advisory Group LLC employees are not investment advisors. Please review:
https://www.stockconsultant.com/disclaimerpage.html

